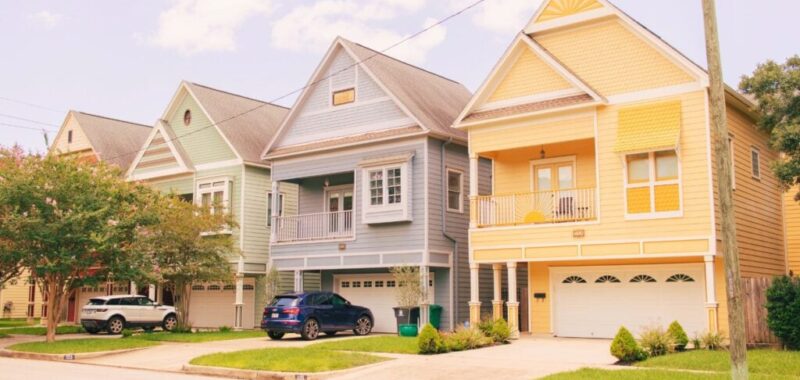
Although home price growth is slowing, S&P CoreLogic’s report also showed that first-time homebuyers are being impacted most by rising prices, since in the last five years, prices in the lower end of the market have risen more quickly than other tiers.
Whether it’s refining your business model, mastering new technologies, or discovering strategies to capitalize on the next market surge, Inman Connect New York will prepare you to take bold steps forward. The Next Chapter is about to begin. Be part of it. Join us and thousands of real estate leaders Jan. 22-24, 2025.
U.S. home prices continued to reach new heights in June, even as the rate of growth slowed as a result of fading inflation, according to dueling reports released Tuesday by the Federal Housing Finance Agency and CoreLogic.
The S&P CoreLogic Case-Shiller Indices and Federal Housing Finance Agency’s House Price Index (FHFA HPI) both reveal a stubborn gap between housing and inflation as prices continue to rise, albeit more gradually, the new data shows.
TAKE THE INMAN INTEL INDEX SURVEY FOR AUGUST
Home prices hit an all-time high as the National Home Price NSA Index rose 5.4 percent on an annual basis, down from a 5.9 percent gain in May, according to CoreLogic. The analytics firm’s 20-City Composite and the 10-City Composite, which track prices in the largest U.S. cities, rose by 6.5 percent and 7.4 percent on an annual basis, down from 6.9 percent and 7.8 percent a month earlier.
On a seasonally adjusted basis, the company’s National Index was up 0.2 percent month over month, while the 20-City Composite was up 0.4 percent and the 10-City Composite up 0.5 percent month over month.
“The S&P CoreLogic Case-Shiller Indices continue to show above-trend real price performance when accounting for inflation,” Brian Luke, head of Commodities, Real & Digital Assets at S&P Dow Jones Indices said.
“Home prices and inflation continue to factor into the political agenda coming into the election season,” Luke said in a statement. “While both housing and inflation have slowed, the gap between the two is larger than historical norms, with our National Index averaging 2.8 percent more than the Consumer Price Index. That is a full percentage point above the 50-year average. Before accounting for inflation, home prices have risen over 1,100 percent since 1974, but have slightly more than doubled (111 percent) after accounting for inflation.”
The FHFA’s home price report, meanwhile, included data for the full second quarter of 2024, showing that home prices in the U.S. rose 5.7 percent from the second quarter of 2023. Compared to the first quarter of 2024, home prices were up 0.9 percent. Meanwhile, the seasonally adjusted monthly index for June was down 0.1 percent from May.
“U.S. home prices saw the third consecutive slowdown in quarterly growth,” Dr. Anju Vajja, deputy director for FHFA’s Division of Research and Statistics, said in a statement. “The slower pace of appreciation as of June end was likely due to higher inventory of homes for sale and elevated mortgage rates.”
The FHFA’s report also noted that the U.S. housing market has seen positive annual price growth each quarter since the beginning of 2012. Between Q2 2023 and Q2 2024, home prices rose in 50 states and the District of Columbia. States with the greatest annual appreciation included Vermont (13.4 percent), West Virginia (12.3 percent), Rhode Island (10.1 percent), Delaware (10.0 percent) and New Jersey (9.9 percent).
Ninety-six out of the top 100 largest metro areas also saw home price growth in the last year, with Syracuse, New York, posting the greatest growth at 14.2 percent. Austin-Round Rock-Georgetown, Texas, saw the largest price decline during that period at -3.2 percent.
All nine U.S. census divisions saw positive home price growth on an annual basis, with the Middle Atlantic posting the greatest growth at 8.5 percent from Q2 2023 to Q2 2024. The West South Central division saw the smallest appreciation during that period at 2.8 percent.
First-time homebuyers are feeling the pain of home price growth the most, since prices in the lower end of the market are rising the most quickly, according to the S&P CoreLogic Case-Shiller Home Price Indices. Over the last five years, 75 percent of markets measured by the indices saw low-price tiers rising faster than the overall market.
“That home prices continue to increase above the rate of inflation isn’t surprising, but the report showed an even more discouraging trend: prices for starter homes are rising faster than the overall market,” Robert Frick, a corporate economist with Navy Federal Credit Union, said in a statement emailed to Inman. “This means reaching the first rung of the homeownership ladder is becoming even tougher for millions of potential homeowners. What were priced as started homes 10 years ago have now been bid up in price so that only middle-income people can afford them.”
Email Lillian Dickerson

